2018 Annual Report

- INTRODUCTION
- Our Vision-Our Mission-Our Strategies
- Corporate Profile
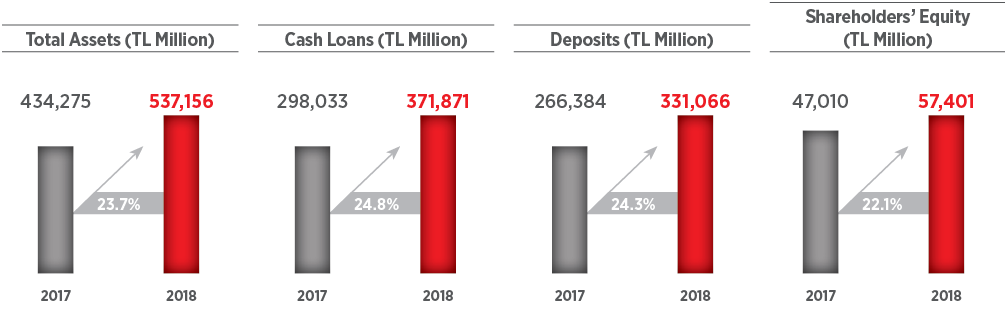
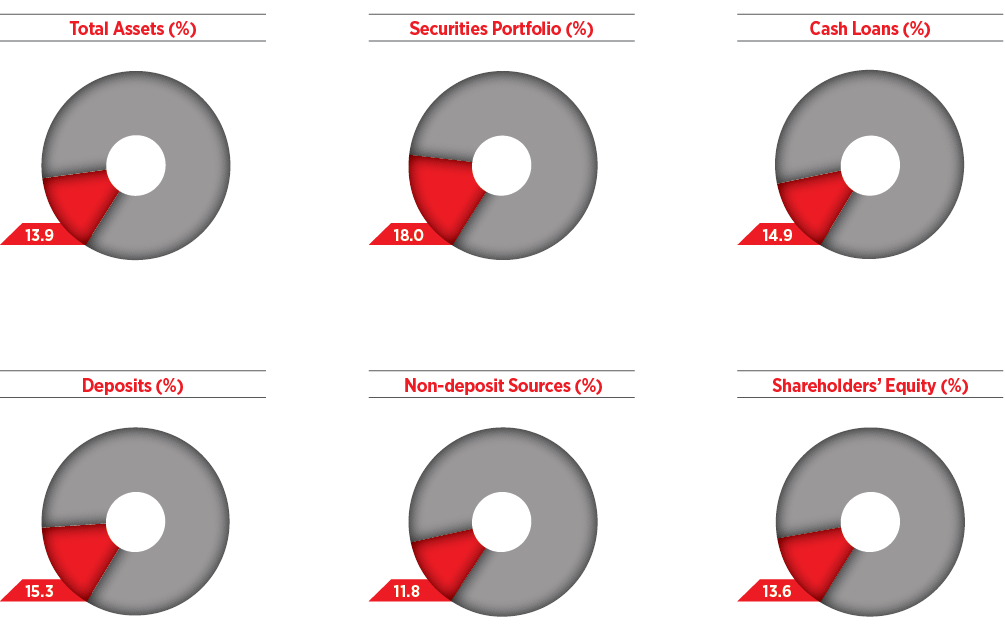
- Financial Indicators
- At Age 155, We Keep On Working Passionately, Creating Value for Our Country Under All Circumstances and Standing by Our Customers…
- Milestones in the History of Ziraat Bank
- Chairman of the Board’s Message
- CEO’s Message
- Macroeconomic Outlook
- An Assessment of 2018: Strategies, Developments and Targets for the Future
- Social Responsibility and Public Relations
- Ziraat Bank’s Subsidiaries in 2018
- Changes in the Articles of Association in 2018
- The Report on Compliance of Annual Report
- MANAGEMENT AND CORPORATE GOVERNANCE PRACTICES
- Ziraat Bank Board of Directors
- Ziraat Bank Senior Management
- Summary Report - Board of Directors
- Human Resources Practices
- Information on the Activities of Committees
- Attendance by the Members of the Board of Directors and of the Audit Committee in the Meetings Held During the Reporting Period
- Related Party Transactions
- Companies from which Support Services are Obtained
- FINANCIAL INFORMATION AND RISK MANAGEMENT
- Audit Committee’s Assessment of the Operation of the Internal Audit, Internal Control, and Risk Management Systems
- Ziraat Bank’s Financial Standing, Profitability and Solvency
- Ratios
- Information about Risk Management Policies and Activities According to Type of Risk
- 31 December 2014-31 December 2018 Summary Balance Sheet and Income Statement
- Credit Ratings Assigned by Rating Agencies
- Publicly Announced Unconsolidated Financial Statements together with Independent Auditor’s Report at 31 December 2018
- Publicly Announced Consolidated Financial Statements together with Independent Auditor’s Report at 31 December 2018
- DIRECTORY